• Authors
  • Contact Us
  • Home
  • ETFs
  • Crypto
  • Investment Products
    • Bonds
    • Shares
  • How To Guides
  • Stocks
  • News
  • About Us
  • Contact Us
No Result
View All Result
  • Home
  • ETFs
  • Crypto
  • Investment Products
    • Bonds
    • Shares
  • How To Guides
  • Stocks
  • News
  • About Us
  • Contact Us
No Result
View All Result
Home How To Guides

How to Collect Historical Stock Market Data in Mircosoft Excel

Invest in ETFs by Invest in ETFs
June 2, 2023
in How To Guides
Reading Time: 2 mins read
Add Stock Prices in Excel
Share on FacebookShare on Twitter

Stepping up from adding company information to Excel, you might find it extremely useful to gather historical stock market data. How has a particular stock performed over time? Has it shown consistent growth or taken a roller coaster ride? Microsoft Excel can answer these questions for you. By using financial APIs or data import functionality, Excel can compile and analyse historical stock data, providing insights into past performance.

The Stockhistory Function

The “STOCKHISTORY” function retrieves historical financial data. It automatically loads the data into an array. The Syntax is as follows,  

=STOCKHISTORY(stock, start_date, [end_date], [interval], [headers], [property0], [property1], [property2], [property3], [property4], [property5])

Step 1 – Choose Your Company & Date Range

Choose a company (again with the “Stock Ticker” as mentioned in our previous article), we will collect data for Microsoft, “MSFT”.

Choose a start date and an end date

It’s important to write your date in the following format

“DD-MM-YYYY”

We will choose “01-01-2015” until “01-01-2020”

Step 2 – Pick Your Interval, Headers & Properties

Now its time to choose an interval and other data for the sheet. You can choose from the following

  • 0 – daily, 1 – weekly, 2 monthly

Choose headers

  • 0 – no headers, 1 show headers, 2 show instrument identifier, and headers

Choose Properties

  • 0 = Date, 1 = Close, 2 = Open, 3 = High, 4 = Low, and 5 = Volume

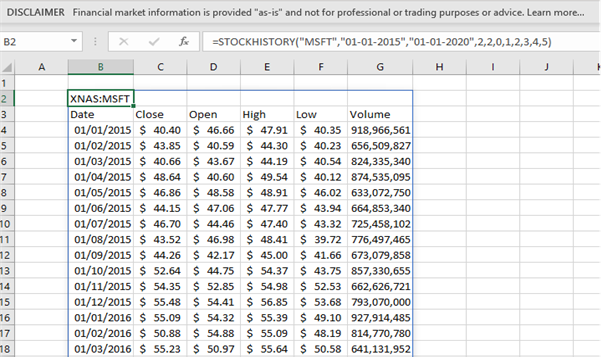
In the below picture, we show an example for Microsoft, highlighting the different inputs.

Example Output

The Example Here Shows the output of data from Microsoft within our chosen timeline.

Invest in ETF Square logo
Invest in ETFs

Share76Tweet48
Invest in ETFs

Invest in ETFs

Related Posts

Add Stock Prices in Excel

How to Add Stock Prices to Microsoft Excel

by Elizabeth Green
May 23, 2023

Tracking stock prices in Microsoft Excel is easy, but first let's discuss some basics. So, what is Microsoft Excel? You...

Load More
Next Post
FTSE 100 and S&P 500

The FTSE 100 vs S&P 500: Analyzing Their Reaction to Uncertainty and Recoveries

Leave a Reply Cancel reply

Your email address will not be published. Required fields are marked *

Table of Contents

  • How to Collect Historical Stock Market Data in Mircosoft Excel
  • The Stockhistory Function
  • Step 1 – Choose Your Company & Date Range
  • Step 2 – Pick Your Interval, Headers & Properties
  • Example Output
  • Home
  • ETFs
  • How To Guides
  • Cryptocurrency
  • News
  • Contact Us

© 2025 Web Design by Turtle Media.

No Result
View All Result
  • Home
  • ETFs
  • Crypto
  • Investment Products
    • Bonds
    • Shares
  • How To Guides
  • Stocks
  • News
  • About Us
  • Contact Us

© 2025 Web Design by Turtle Media.