
Tracking stock prices in Microsoft Excel is easy, but first let’s discuss some basics. So, what is Microsoft Excel? You may be familiar with this versatile tool, but how often do we harness its full potential? Microsoft Excel, a household name in spreadsheet applications, is a really good companion to the financial world. Today, we uncover the power lying within Excel’s financial functionalities. In particular, how to extract stock data. Beyond grabbing live data, you can also grab historical data. This can be useful if you want to assess your portfolio holdings in Excel! Please read our disclaimer and remember to speak to a professional before investing!
Get The Basic Stock Prices & Info Into Excel
Let’s kickstart with the basics. How often do you find yourself scrambling through various websites, aggregating company data? Well, Excel simplifies this process. Microsoft Excel has web querying tools that extract company information from websites, bringing all the essential details to a single place.
Excel can read “stock symbols” or “stock tickers”
“Stock tickers” are unique characters given to companies that are listed on stock exchanges. They are just shorthand of identifying a companies stock. The ticker depends on what stock market the company is listed in, for example, the New York Stock Exchange (NYSE) can have four or fewer letters, while on the National Association of Securities Dealers Automated Quotations (NASDAQ) can have up five characters. There is no significant difference between companies with 3-character symbols or 5-character ones.
They are sometimes referred to as ticker symbols or tickers.
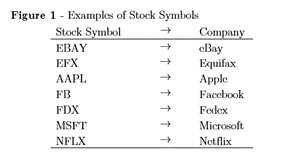
Microsoft Excel can read Stock Symbols and collect company information,
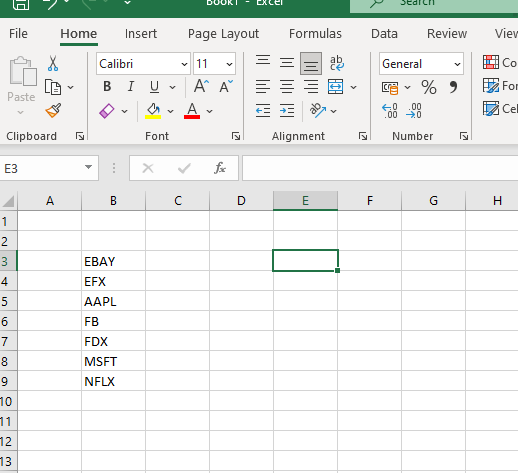
Step 1 – Type the stock symbols into an Excel spreadsheet
You can get the full list here https://stockanalysis.com/stocks/
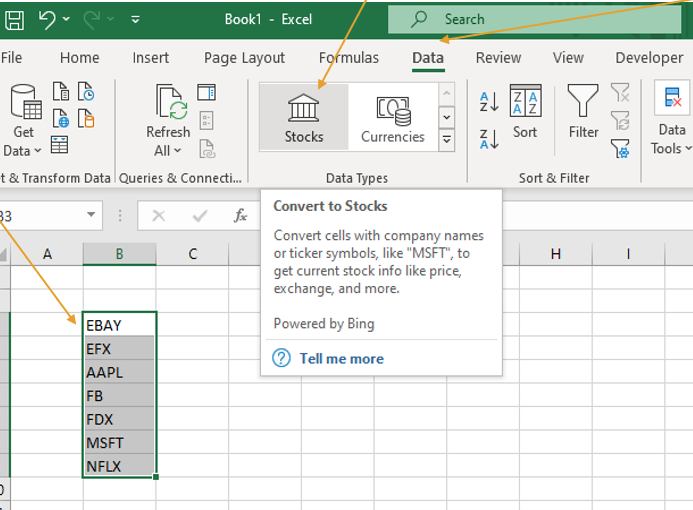
Step 2 – Check Your Tickers Have Been Recognised
It’s important to do this, otherwise you may be chasing your tail and wondering why your data isn’t showing how it should.
Highlight the data and click “Stocks” (located inside the Data tab)
To check that the “Stock Tickers” have been converted, you should see a small symbol next to each of the companies.
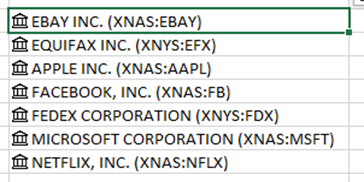
Step 3 – Browse the Data
To do this, click on one of the companies, you will see a small box appears to the right.
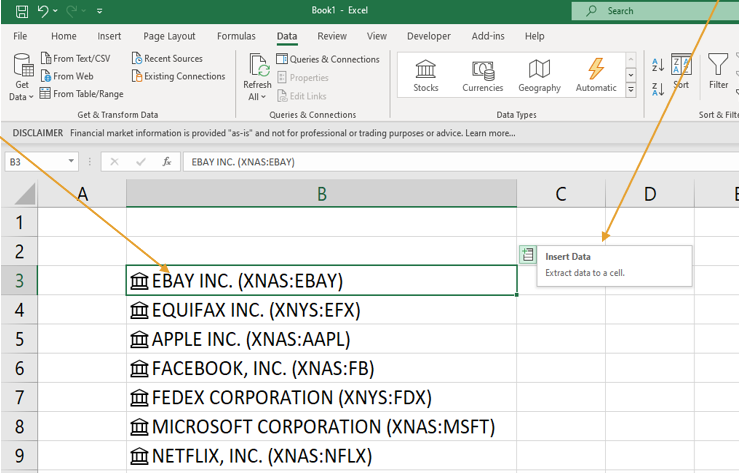
A list of information that is available will appear.
Click on the information you want and this will become available to the right of the company name. Repeat this process for all the data you would like to display. You can see an example of company data we’ve gathered for some large stocks in Microsoft Excel below.

An Example of Stock Prices Company Data in Excel
Here is an example of the kind of information that you can collect for big companies like EBAY, APPLE and NETFLIX.
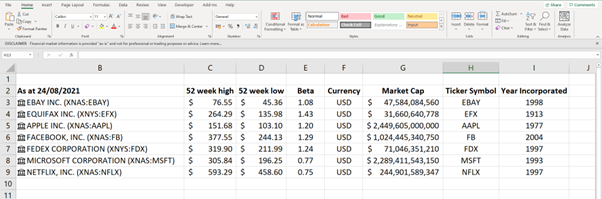
Whilst this shows us how to get current information on companies, you can also look at the history of companies via the stock history function. We will cover that in depth in our next article.
Other Ways We Can Use Excel
Excel is a very powerful piece of software and can be utilised in a lot of ways for tracking, monitoring and ensuring your portfolio doing exactly what it should. Here is a small list of some extra items we can do to help you on your investment journey.
Gathering historical stock market data.
Merging data to manage an investment portfolio.
Microsoft Excel: An Essential Introduction
If you aren’t already familiar with Microsoft Excel, it’s time to acquaint yourself with this excellent financial ally. Excel is more than a simple spreadsheet application. It’s a dynamic tool that can analyse and store data, perform calculations, and help with decision-making. It’s about time we delve into its financial functions.

